 gaetano
 Custom Dashboard with Splunk
Motivation
Customers can use the APIC GUI to monitor the available logical resources in their ACI fabric environment. The values are presented in the Operations -> Capacity Dashboard.
However, the customers might be required to monitor a metric not available by default on the Capacity Dashboard.
Not all of the parameters described in the scalability ACI Guide for 5.2(8) release are available in the Capacity Dashboard.
For example, according to the scalability guide, if a customer is using L3 Fabric solution, with a network-centric design in which every EPG uses one BD and one encapsulation VLAN, the maximum number of BD that can be deployed on a leaf node is 1980:
 Maximum number of BD per leaf
It is useful to monitor this parameter periodically to control how the fabric grows and for optimal endpoint distribution among the ACI fabric node leaf.
Other parameters can be extracted based on customer needs and monitored in a customized dashboard.
This post shows how to extract parameters using a Python script that relies on APIC rest API. These parameters are processed and collected in a CSV file. Then, this CSV file is fed into Splunk Enterprise to monitor what is relevant.
ACI Fabric Data Extraction with REST API
The Python script available on my GitHub can be used to retrieve the following data in a CSV file:
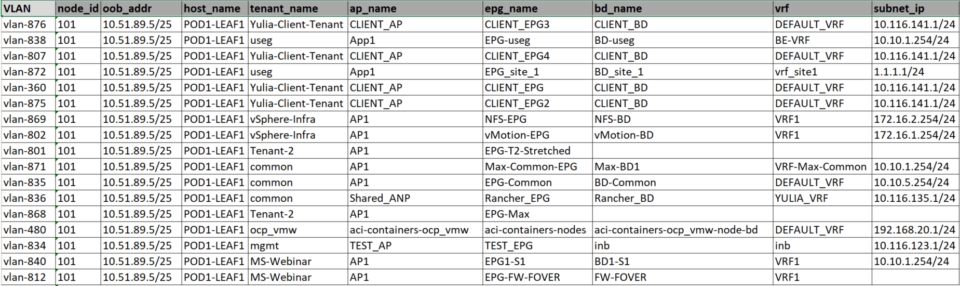 Example of a CSV file extracted from an ACI Fabric with Python Script
An example of the CSV file extracted from a Demo ACI Fabric can be downloaded here:
CSV File Fields Explanation
VLAN
- Description: The external VLAN encapsulation identifier used by the corresponding EPG, in the format
vlan-<number>. This is a unique label for the VLAN. - Example:
vlan-876
node_id
- Description: An identifier for the specific node (or switch) within the ACI fabric.
- Example:
101
oob_addr
- Description: The out-of-band IP address for the node. This is used for management and administrative tasks outside of the data traffic.
- Example:
10.51.89.5/25
host_name
- Description: The hostname of the switch or node in the ACI fabric. This is a label assigned to the hardware device for easier identification.
- Example:
POD1-LEAF1
tenant_name
- Description: The name of the tenant within the ACI fabric. In ACI, tenants represent isolated virtualized environments or groups.
- Example:
Pippo-Tenant
ap_name
- Description: The name of the Application Profile. It is a container for EPGs (End Point Groups) and is used to group related application components.
- Example:
CLIENT_AP
epg_name
- Description: The name of the End Point Group. EPGs represent a set of endpoints (devices, servers, etc.) that share common policies and configurations.
- Example:
CLIENT_EPG3
bd_name
- Description: The name of the Bridge Domain. Bridge Domains represent Layer 2 broadcast domains and are used to define the scope of Layer 2 traffic.
- Example:
CLIENT_BD
vrf
- Description: The name of the Virtual Routing and Forwarding instance. VRFs are used to create isolated Layer 3 routing tables.
- Example:
DEFAULT_VRF
subnet_ip
- Description: The subnet IP address and subnet mask associated with the Bridge Domain. This defines the IP range used by the BD for Layer 3 routing.
- Example:
10.116.141.1/24
Splunk Usage
Splunk Installation
Demonstration of the process to install Splunk Enterprise on Linux:
Importing the CSV File in Splunk
Splunk can be integrated with Python for real-time data processing. The output of Python scripts can be used for many purposes. This is also the case for the script used in this post.
For the sake of simplicity the CSV file, generated by the script above, is imported as Lookup Table instead of Scripted Input:
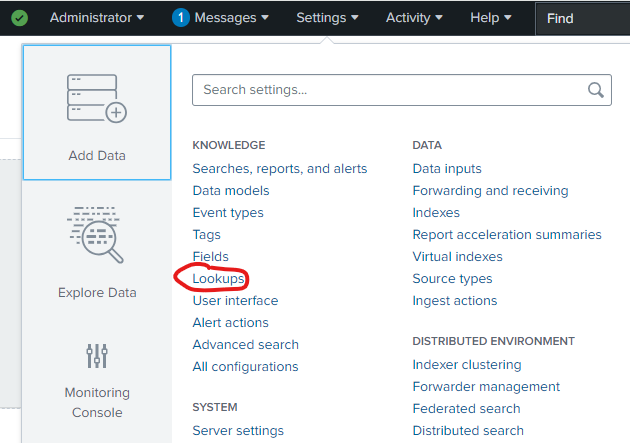
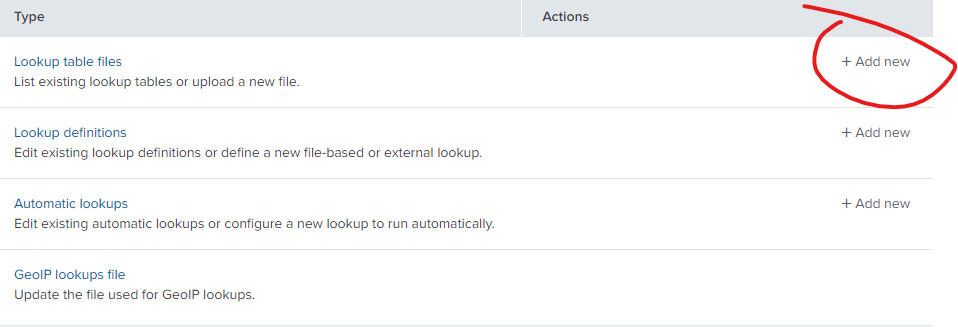
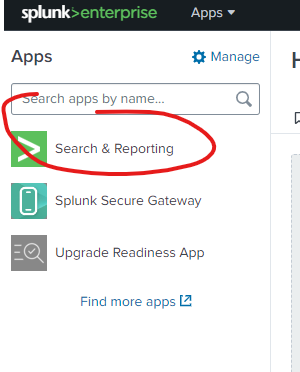
Once the CSV is imported it can be seen in the Search & Reporting Splunk app:
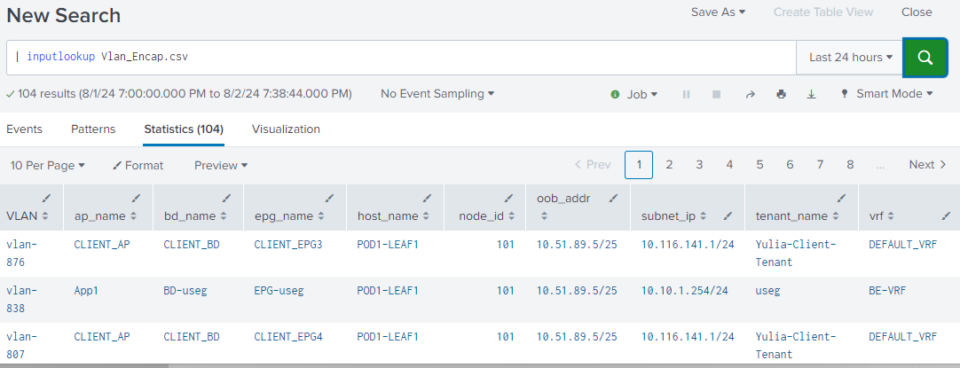
The Splunk command | inputlookup Vlan_Encap.csv is used to retrieve data from a lookup table file within the Splunk panel.
Creating Splunk Dashboard
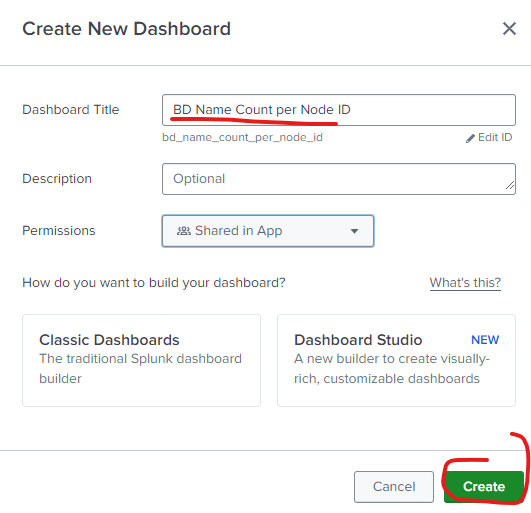
Go to Dashboards (found under the Search & Reporting app or from the top navigation bar). Click Create New Dashboard.

Create Dropdown Menu
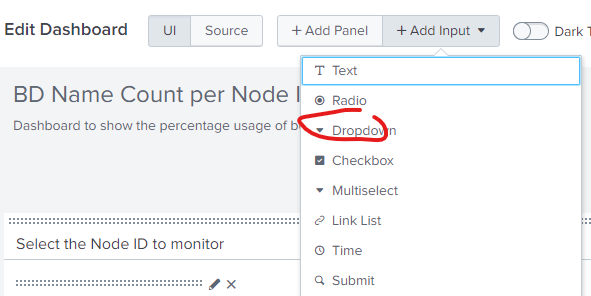
We would like to obtain a dropdown menu for selecting the node ID under investigation among the ones in the ACI Fabric as shown below:
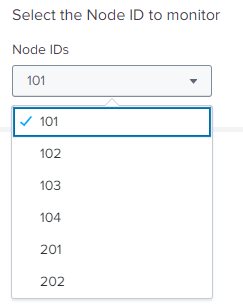 Dropdown menu
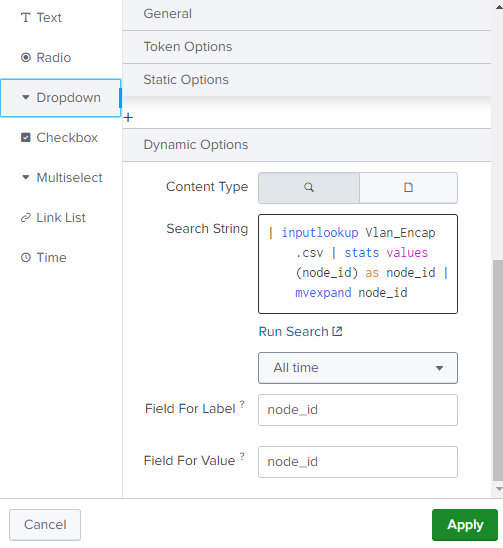
Go to Edit on the dashboard. Click Add Input and choose Dropdown. Configure the dropdown to list node_id values:
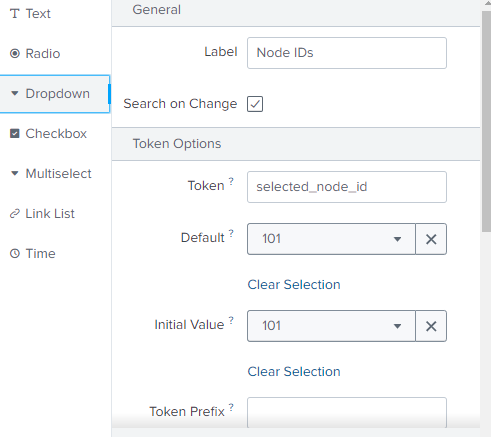
Set a token name for the selected node_id (e.g., selected_node_id).
| inputlookup Vlan_Encap.csv
| stats values(node_id) as node_id
| mvexpand node_id
The query search used in this dropdown menu is used for selecting the node ID under investigation. Here it follows an explanation:
| inputlookup Vlan_Encap.csvThis command retrieves the contents of the lookup table Vlan_Encap.csv. It loads the entire data from this CSV file into the search pipeline.
| stats values(node_id) as node_idThe stats command is used to perform statistical operations on the data. In this case, it is aggregating data:
values(node_id): this function collects all unique values for thenode_idfield from the data retrieved byinputlookup. It removes any duplicatenode_idvalues.as node_id: this renames the resulting field fromvalues(node_id)tonode_id. Essentially, it consolidates all uniquenode_idvalues into a single field namednode_id.
| mvexpand node_idThe mvexpand command is used to expand multi-value fields into separate events. The field node_id is passed to mvexpand. This command is especially useful if node_id contains multiple values (which can happen if stats values collects multiple values into an array). In this case, mvexpand ensures that each unique node_id value is presented as a separate event.
Creating Radial Gauge
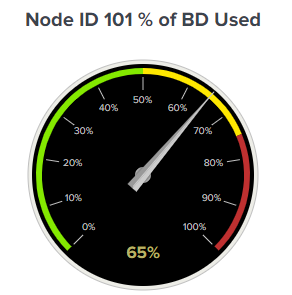
The Radial Gauge will graphically show the % of BD used on a node leaf concerning the maximum value according to the scalability guide and customer environment as shown below:
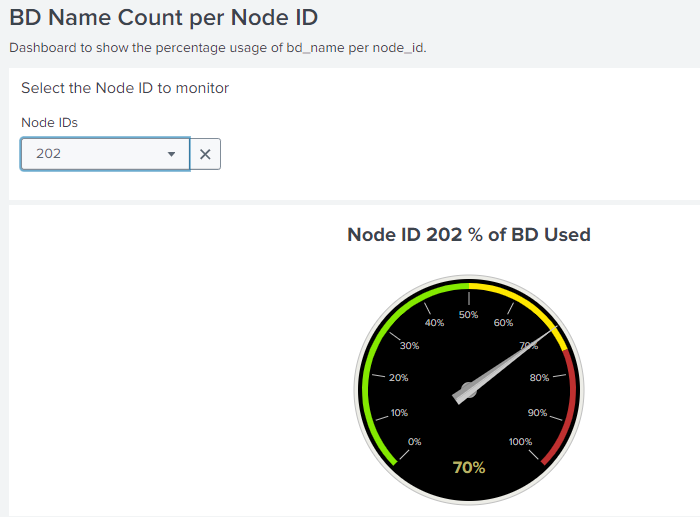 Radial Gauge
Add a panel as follows:
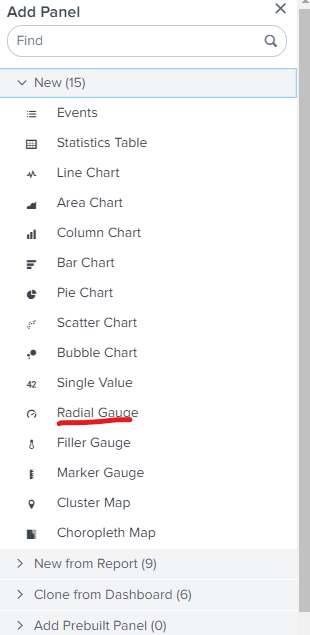
The query search for the Radial Gauge will look like this:
| inputlookup Vlan_Encap.csv
| stats dc(bd_name) as unique_bd_name_count by node_id
| eval max_bd_name = 1980
| eval percent_usage = (unique_bd_name_count / max_bd_name) * 100
| search node_id="$selected_node_id$"
| fields percent_usage
Creating Global Statistic Table
The statistic table shows a global view of BD used on all node leaves in the ACI fabric:
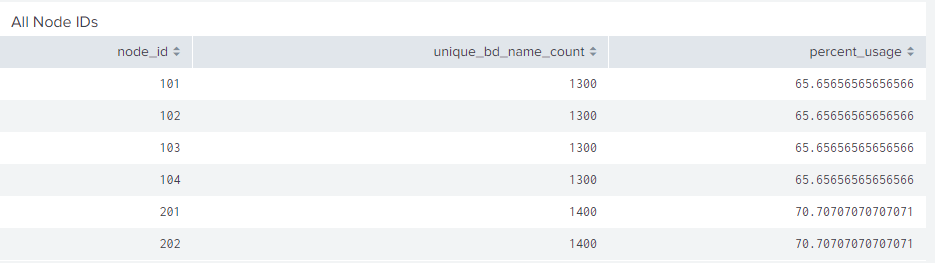 Statistic Table
| inputlookup Vlan_Encap.csv
| stats dc(bd_name) as unique_bd_name_count by node_id
| eval max_bd_name = 1980
| eval percent_usage = (unique_bd_name_count / max_bd_name) * 100
| fields node_id, unique_bd_name_count, percent_usage
Overall Dashboard XML
The entire dashboard can be replicated by copying the following XML into the source code of the dashboard:
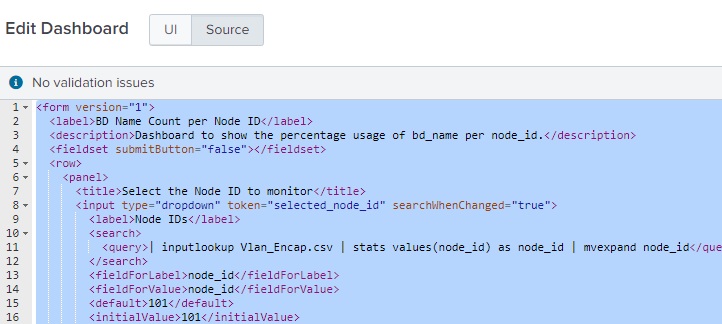 Dashboard XML source code
<form version="1">
  <label>BD Name Count per Node ID</label>
  <description>Dashboard to show the percentage usage of bd_name per node_id.</description>
  <fieldset submitButton="false"></fieldset>
  <row>
    <panel>
      <title>Select the Node ID to monitor</title>
      <input type="dropdown" token="selected_node_id" searchWhenChanged="true">
        <label>Node IDs</label>
        <search>
          <query>| inputlookup Vlan_Encap.csv | stats values(node_id) as node_id | mvexpand node_id</query>
        </search>
        <fieldForLabel>node_id</fieldForLabel>
        <fieldForValue>node_id</fieldForValue>
        <default>101</default>
        <initialValue>101</initialValue>
      </input>
    </panel>
  </row>
  <row>
    <panel>
      <html>
        <div style="text-align: center;">
          <h1>Node ID $selected_node_id$ % of BD Used</h1>
        </div>
      </html>
      <chart>
        <search>
          <query>| inputlookup Vlan_Encap.csv
| stats dc(bd_name) as unique_bd_name_count by node_id
| eval max_bd_name = 1980
| eval percent_usage = (unique_bd_name_count / max_bd_name) * 100
| search node_id="$selected_node_id$"
| fields percent_usage</query>
          <earliest>-15m</earliest>
          <latest>now</latest>
        </search>
        <option name="charting.chart">radialGauge</option>
        <option name="charting.chart.rangeValues">[0,50,75,100]</option>
        <option name="charting.chart.showLabels">1</option>
        <option name="charting.chart.showMajorTicks">1</option>
        <option name="charting.chart.showMinorTicks">0</option>
        <option name="charting.chart.showValue">1</option>
        <option name="charting.chart.style">shiny</option>
        <option name="charting.chart.usePercentageRange">1</option>
        <option name="charting.chart.usePercentageValue">1</option>
        <option name="charting.gaugeColors">["0x84E900","0xFFE800","0xBF3030"]</option>
        <option name="refresh.display">progressbar</option>
      </chart>
    </panel>
  </row>
  <row>
    <panel>
      <title>All Node IDs</title>
      <table>
        <search>
          <query>| inputlookup Vlan_Encap.csv
| stats dc(bd_name) as unique_bd_name_count by node_id
| eval max_bd_name = 1980
| eval percent_usage = (unique_bd_name_count / max_bd_name) * 100
| fields node_id, unique_bd_name_count, percent_usage</query>
          <earliest>-15m</earliest>
          <latest>now</latest>
        </search>
        <option name="count">10</option>
        <option name="drilldown">none</option>
        <option name="refresh.display">progressbar</option>
      </table>
    </panel>
  </row>
</form>
Automation and Scaling
To automate CSV generation from APIC, use the provided Python script that:
- Connects to APIC via REST API
- Queries all BDs and EPGs across the fabric
- Extracts VLAN encapsulation per leaf
- Exports to CSV for Splunk ingestion
Schedule this script as a cron job to refresh the lookup table periodically (hourly or daily depending on your environment).